
How Survivorship Bias Can Skew Your Views on Mutual Fund Performance
It’s important to avoid treating the market like a popularity contest by chasing out-performers or running away from the underdogs. But neither do most investors want to go into the market entirely blind. For that, there are database services that track and report on how various fund managers and their offerings have performed.
Besides ample evidence that past performance does not predict future returns, there is another reason we advise investors to proceed with caution when considering past performance: Many returns databases are weakened by survivorship bias.
With respect to mutual funds and similar investment vehicles, survivorship bias creeps in when only the returns from surviving funds are included in the historical returns data you are viewing.
Here is what happens: As you might expect, there is a tendency for outperforming funds to survive, and for under-performers to disappear. When a fund is liquidated or merged out of existence, if its poor returns data disappears as well, overall historic returns tend to tick upward.
As such, you may end up depending on past performance data that is optimistically inaccurate.
Here is an article that further explains how survivorship bias works. In addition, consider the following illustration from Dimensional Fund Advisors’ report, The US Mutual Fund Landscape 2016. It illustrates how survivorship bias can skew your view on fund performance.
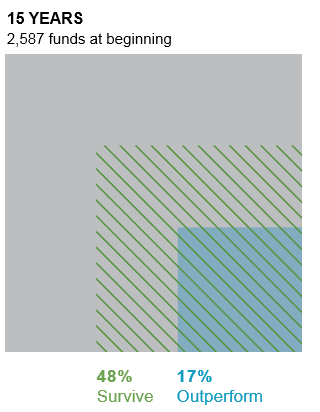
In the beginning – in this case January 1, 2001 – there were 2,758 US equity mutual funds. Now fast-forward 15 years to December 31, 2015. By then, only 43% of those funds (roughly 1,186 funds) had survived the period. Out of the survivors, only 17% (about 469 funds) had both survived and outperformed their benchmark over the 15-year time-frame.1
In the illustration above, you can readily see that the small blue box in the lower-right corner represents relatively low, less than 1:5 odds that any given fund in January 2001 went on to outperform its peers by the end of the 15 years.
If a database instead eliminates the “disappeared” funds from its performance data, the larger gray box disappears from view as well, as in the illustration below. Without this critical larger context, you may conclude that those 469 outperforming funds only had to compete against the 1,186 survivors, versus the actual universe of 2,758 funds. While it may seem as if nearly half of the fund universe has done well, in reality, the less than 1:5 odds have remained unchanged.

You see 100% of what has survived and just over 40% outperforming!
But wait, maybe you could “take a look at the past performance, pick the funds that have outperformed after the first 10 years, and pile up on those seeming winners. Dimensional’s report also shares the results from that exercise:
The left-hand side of this diagram shows the funds that outperformed (in blue) and under-performed (in gray) during the first 10 years of the 15-year analysis.2 You can see that 20% outperformed their respective benchmark then. The right-hand side of the diagram shows what happened to that outperforming subset during the next five years. Only 37% of the initial “winners” continued to outperform. This demonstrates that is it is extremely hard to predict “winning” mutual funds based on past performance. Your odds are even worse than what you can expect from a basic coin toss!
So let’s take a moment to reinforce our ongoing advice: Invest for the long-term. Instead of fixating on past performance, focus on capturing future available returns within your risk tolerances and according to the best available evidence. Aggressively manage the factors you can expect to control (such as managing expenses) and disregard the ones that you cannot (such as picking future winners based on recent past performance).
These principles guide the actions we’ve advised all along. We will continue to embrace them unless compelling evidence were ever to inform us otherwise. They are the ones that serve your highest financial interests, which is our highest priority as your advisor.
1. Beginning sample includes funds as of the beginning of the 15-year period ending December 31, 2015. The number of beginners is indicated below the period label. Survivors are funds that were still in existence as of December 31, 2015. Non-survivors include funds that were either liquidated or merged. Out-performers (winners) are funds that survived and beat their respective benchmarks over the period. Past performance is no guarantee of future results. See Mutual Fund Landscape paper for more information. US-domiciled mutual fund data is from the CRSP Survivor-Bias-Free US Mutual Fund Database, provided by the Center for Research in Security Prices, University of Chicago.
2. The graph shows the proportion of US equity mutual funds that outperformed and under-performed their respective benchmarks (i.e., winners and losers) during the initial 10-year period ending December 31, 2010. Winning funds were re-evaluated in the subsequent five-year period from 2011 through 2015, with the graph showing winners (out-performers) and losers (under-performers). The sample includes funds at the beginning of the 10-year period, ending in December 2010. The graph shows the proportion of funds that outperformed and under-performed their respective benchmarks (i.e., winners and losers) during the initial periods. Winning funds were re-evaluated in the subsequent period from 2011 through 2015, with the graph showing the proportion of out-performance and under-performance among past winners. (Fund counts and percentages may not correspond due to rounding.) Past performance is no guarantee of future results. See Data appendix for more information. US-domiciled mutual fund data is from the CRSP Survivor-Bias-Free US Mutual Fund Database, provided by the Center for Research in Security Prices, University of Chicago.
Robert J. Pyle, CFP®, CFA is president of Diversified Asset Management, Inc. (DAMI). DAMI is licensed as an investment adviser with the State of Colorado Division of Securities, and its investment advisory representatives are licensed by the State of Colorado. DAMI will only transact business in other states to the extent DAMI has made the requisite notice filings or obtained the necessary licensing in such state. No follow up or individualized responses to persons in other jurisdictions that involve either rendering or attempting to render personalized investment advice for compensation will be made absent compliance with applicable legal requirements, or an applicable exemption or exclusion. It does not constitute investment or tax advice. To contact Robert, call 303-440-2906 or e-mail info@diversifiedassetmanagement.com.
The views, opinion, information and content provided here are solely those of the respective authors, and may not represent the views or opinions of Diversified Asset Management, Inc. The selection of any posts or articles should not be regarded as an explicit or implicit endorsement or recommendation of any such posts or articles, or services provided or referenced and statements made by the authors of such posts or articles. Diversified Asset Management, Inc. cannot guarantee the accuracy or currency of any such third party information or content, and does not undertake to verify or update such information or content. Any such information or other content should not be construed as investment, legal, accounting or tax advice.